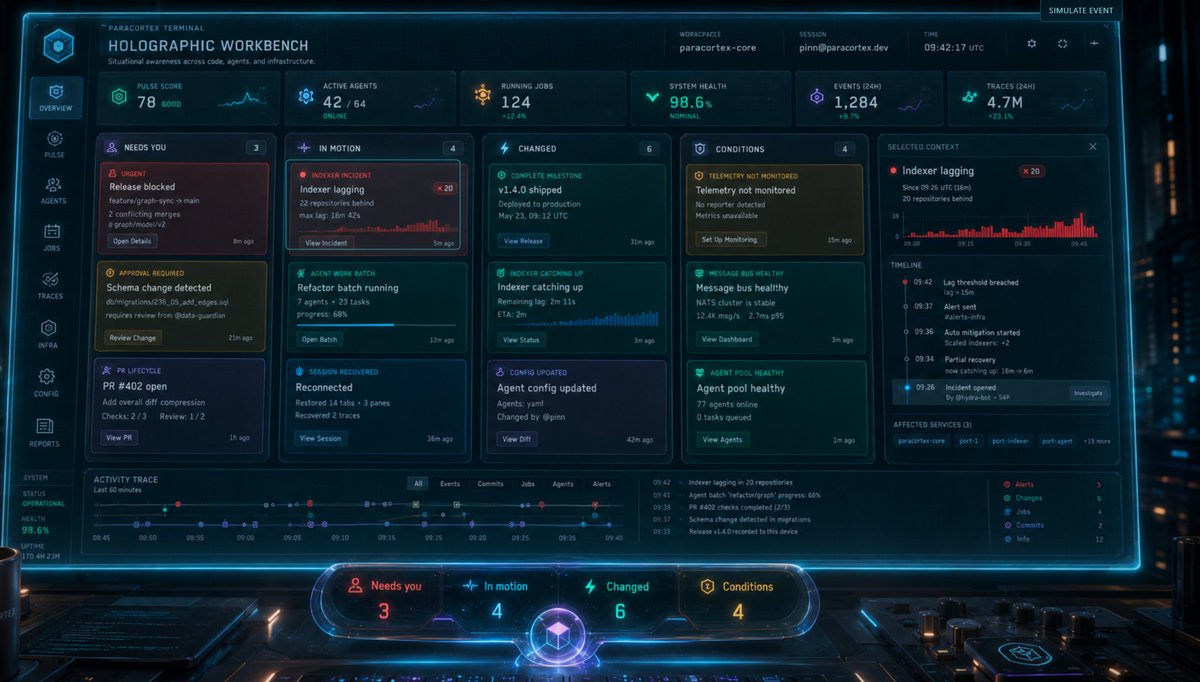
Holographic Sci-Fi Operations Dashboard
Generates a cinematic neon glassmorphism command-center dashboard mockup for futuristic SaaS, DevOps, or AI agent monitoring prototypes.
这是一个用于 产品与商业 的 GPT Image 2 提示词案例。你可以复制下方 prompt 生成相似图片;商用前请复核 Awesome GPT Image 2 Prompts 来源归因和原始权利。
需要完整提示词集合?请使用 产品与商业 主题页获取更多同类示例,或打开 GPT Image 2 提示词库 查看完整示例索引、可复用结构和来源归因。
免费 1K 极速预览
无需注册,立即生成一张预览图。
2632/4000
提示词
可复制提示词
目标:创建一个电影级科幻产品模型,展示一个未来感操作仪表盘,标题为 {argument name="product title" default="HOLOGRAPHIC WORKBENCH"},悬浮在赛博朋克指挥中心深色控制台上方,呈现为半透明的霓虹蓝全息屏幕。

画布:宽屏 16:9 横向界面截图,深海军蓝/黑色玻璃拟态 UI,发光的青色边框,细微的扫描线,微小的网格纹理,高细节,逼真的 GPT-image-2 风格渲染,浅景深,背景中有模糊的服务器灯光。界面应呈现出一种构建在精美概念渲染之上的可点击原型感。

页眉:左上角品牌文字显示“PARACORTEX TERMINAL”,下方为主标题“HOLOGRAPHIC WORKBENCH”,副标题为“Situational awareness across code, agents, and infrastructure.”。顶部中央元数据精确显示 3 个字段:工作区 “paracortex-core”,会话 “[email protected]”,时间 “09:42:17 UTC”。右上角包含一个标有 “SIMULATE EVENT” 的小按钮,以及微小的齿轮、同步和加号图标。

左侧导航:一个垂直的发光侧边栏,包含 8 个图标导航项,从上到下依次为:Overview、Pulse、Agents、Jobs、Traces、Infra、Config、Reports。左下角包含一个小型的系统状态面板,显示状态 “Operational”,健康度 “98.6%”,运行时间 “170 4H 23M”。

顶部指标行:顶部显示 6 个统计卡片。卡片 1:“PULSE SCORE”,数值 “78”,状态 “GOOD”,配有小型折线图。卡片 2:“ACTIVE AGENTS”,数值 “42 / 64”,状态 “ONLINE”。卡片 3:“RUNNING JOBS”,数值 “124”,状态 “+12.4%”。卡片 4:“SYSTEM HEALTH”,数值 “98.6%”,状态 “NOMINAL”。卡片 5:“EVENTS (24H)”,数值 “1,284”,状态 “+8.7%”。卡片 6:“TRACES (24H)”,数值 “4.7M”,状态 “+23.1%”。

主布局:在指标行下方,创建 5 个大型垂直列/卡片。第 1 列为 “NEEDS YOU”,徽章计数 3,包含 3 个任务卡片:“Release blocked”(红色紧急样式)、“Schema change detected”(黄色审批样式)和 “PR #402 open”(紫色生命周期样式)。第 2 列为 “IN MOTION”,徽章计数 4,包含 3 个可见任务卡片:“Indexer lagging”(红色事故,带 x20 徽章和微型柱状图)、“Refactor batch running”(青色进度条)和 “Reconnected”(蓝色会话恢复样式)。第 3 列为 “CHANGED”,徽章计数 6,包含 3 个任务卡片:“v1.4.0 shipped”、“Indexer catching up”(带迷你柱状图)和 “Agent config updated”。第 4 列为 “CONDITIONS”,徽章计数 4,包含 3 个任务卡片:“Telemetry not monitored”、“Message bus healthy” 和 “Agent pool healthy”。第 5 列为右侧 “SELECTED CONTEXT” 详情面板,聚焦于 {argument name="selected incident" default="Indexer lagging"},显示红色 x20 徽章、红色直方图、带有时间戳的垂直时间轴以及受影响的服务标签。

选定上下文详情:右侧详情面板应包含标题 “Indexer lagging”,副标题 “Since 09:25 UTC (16m)” 和 “20 repositories behind”。添加一个底部标有 09:00、09:15、09:30、09:45 等时间的红色柱状图。时间轴包含 5 个条目:“09:42 Lag threshold breached”、“09:37 Alert sent”、“09:36 Auto mitigation started”、“09:34 Partial recovery” 和 “09:26 Incident opened”。添加一个标有 “Investigate” 的小按钮。受影响的服务标签:“paracortex-core”、“port-1”、“port-indexer”、“port-agent”、“+15 more”。

底部活动区域:在主列下方添加一个横跨宽度的 “ACTIVITY TRACE” 面板,标注为 “Last 60 minutes”。包含一个带有彩色圆点的水平时间轴,以及 6 个过滤标签:“All”、“Events”、“Commits”、“Jobs”、“Agents”、“Alerts”。在此面板右侧,包含一个紧凑的事件列表和一个包含 6 个类别的微型图例:Alerts、Changes、Jobs、Commits、Infra、Info。

前景控件:在底部中央,放置一个悬浮在屏幕前方的独立圆形玻璃状态底座。它包含 4 个与列对应的计数器:“Needs you 3”(红色)、“In motion 4”(蓝色)、“Changed 6”(青色)、“Conditions 4”(琥珀色)。底座中心包含一个发光的紫蓝色立方体球体徽标。

颜色与风格:使用霓虹青色轮廓、青色和电蓝色光晕、红色(事故)、琥珀色(警告)、紫色(生命周期/会话项)。UI 面板为半透明深色玻璃,圆角设计。文字较小但清晰可辨、技术感强、密集且精致。在桌面上添加细微的反射,底部边缘有小型物理旋钮和屏幕,以及大气感的蓝色光束。

约束:保持所有列出的计数精确:8 个侧边栏项目,6 个顶部指标卡片,5 个主列,15 个可见主任务/详情卡片(包含右侧选定上下文面板),6 个过滤标签,6 个图例类别,以及 4 个底座计数器。不要添加人物。不要使用纯白色背景。避免卡通风格;使其看起来像一个高端科幻 SaaS 仪表盘原型。
提示词变量
从提示词中识别到的可编辑 argument 占位符及默认值。
变量
product title
默认值
HOLOGRAPHIC WORKBENCH
变量
selected incident
默认值
Indexer lagging
Best for
- - 产品商业 方向的视觉探索
- - 图片生成与参考图改写
- - 需要保留来源归因的可复用 brief
可以替换这些部分
- - 主体、产品、角色或场景
- - 画幅、镜头、光线和背景
- - 品牌、文字、颜色和输出限制
推荐模型与设置
- - 模型:gpt-image-2
- - 输入模式:文生图
- - 画幅:source
- - 商用状态:需复核原始来源
如何使用这个提示词
- 1. 复制提示词并先保留原始结构。
- 2. 替换主体、场景和输出渠道。
- 3. 每次只调整一个镜头、光线或风格变量。
- 4. 检查结果媒体、文字、来源和权利风险。
限制、来源与复用提醒
- - 生成结果是可编辑草稿,不是事实、法务或权利证明。
- - 商用前复核来源链接、人物、品牌、Logo、文字和第三方素材。
导入自 Awesome GPT Image 2 Prompts。需要保留来源归因。商业使用状态:allowed;付费使用前请复核原始权利。
同分类案例
优先推荐同分类、同输入模式且风险更低的案例。




复用与来源说明
看完案例后,再安全复用这个提示词。
- 1.复制 prompt,或点击生成入口在 Dovoo 中直接打开。
- 2.按你的用途调整变量、画面比例和参考图。
- 3.发布或商用前,复核来源权利、归因要求以及品牌、肖像或版权风险。
这个提示词可以商用吗?
当前商业使用状态为 allowed。付费或公开使用前,请复核原始来源、许可、品牌限制和法务要求。
这个案例来自哪里?
该案例导入自 Awesome GPT Image 2 Prompts;复用时请保留来源归因,并打开来源 URL 检查最新授权信息。