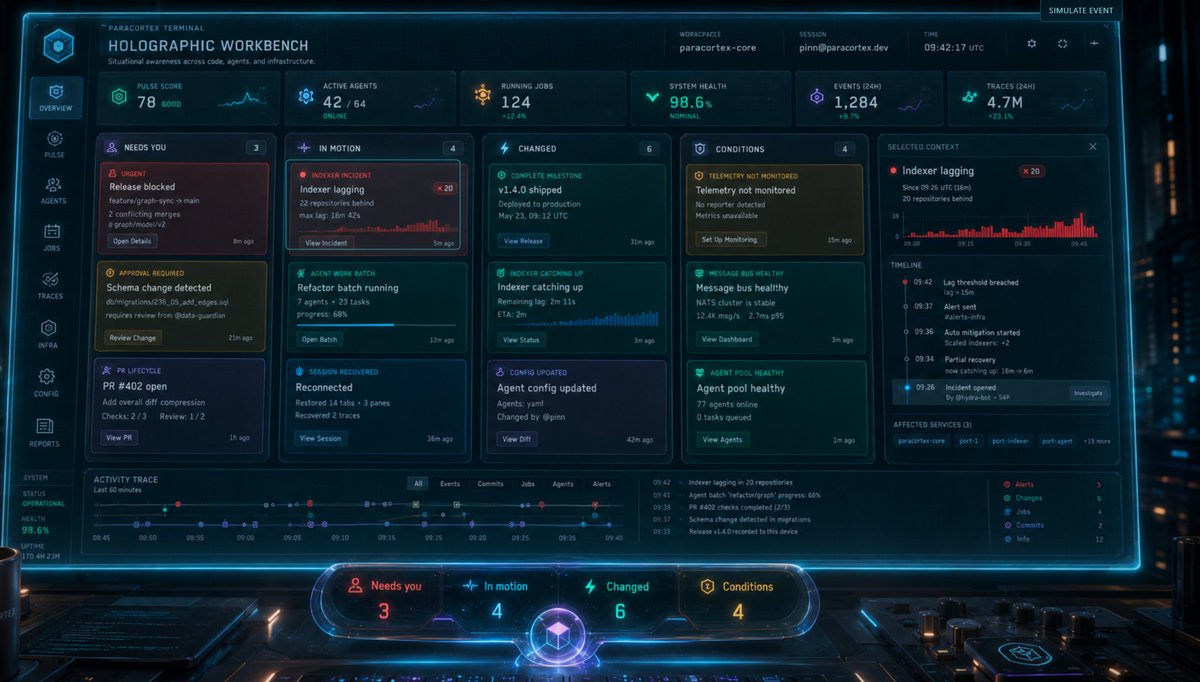
Holographic Sci-Fi Operations Dashboard
Generates a cinematic neon glassmorphism command-center dashboard mockup for futuristic SaaS, DevOps, or AI agent monitoring prototypes.
Este é um exemplo de prompt GPT Image 2 para Produto e Comercial . Use o prompt pronto para copiar abaixo para gerar visuais semelhantes e revise a atribuição Awesome GPT Image 2 Prompts e os direitos de uso comercial antes de reutilizá-los.
Precisa do conjunto completo de instruções? Use o Produto e Comercial Para obter mais exemplos relacionados, acesse o hub de tópicos ou abra o GPT Image 2 catálogo de prompts Para obter o índice completo de exemplos, estruturas reutilizáveis e atribuição de fontes.
Free 1K preview
Generate one preview image instantly, no sign-up required.
4000/4000
Incitar
prompt pronto para copiar
Goal: Create a cinematic sci-fi product mockup of a futuristic operations dashboard titled {argument name="product title" default="HOLOGRAPHIC WORKBENCH"}, floating as a transparent neon-blue holographic screen above a dark control desk in a cyberpunk command center.

Canvas: Wide 16:9 landscape interface screenshot, dark navy/black glassmorphism UI, glowing cyan borders, subtle scanlines, tiny grid texture, high detail, realistic GPT-image-2 style render, shallow depth of field with blurred server lights in the background. The interface should feel like a clickable prototype built on top of a beautiful concept render.

Header: Top-left brand text reads “PARACORTEX TERMINAL” above the main title “HOLOGRAPHIC WORKBENCH” with the subtitle “Situational awareness across code, agents, and infrastructure.” Top-center metadata shows exactly 3 fields: Workspace “paracortex-core”, Session “[email protected]”, Time “09:42:17 UTC”. Top-right includes a small button labeled “SIMULATE EVENT” plus tiny gear, sync, and plus icons.

Left navigation: A vertical glowing sidebar with exactly 8 icon navigation items labeled, from top to bottom: Overview, Pulse, Agents, Jobs, Traces, Infra, Config, Reports. At the lower left, include a small system status panel with Status “Operational”, Health “98.6%”, and Uptime “170 4H 23M”.

Top metric row: Show exactly 6 stat cards across the top. Card 1: “PULSE SCORE” value “78” status “GOOD” with a small line graph. Card 2: “ACTIVE AGENTS” value “42 / 64” status “ONLINE”. Card 3: “RUNNING JOBS” value “124” status “+12.4%”. Card 4: “SYSTEM HEALTH” value “98.6%” status “NOMINAL”. Card 5: “EVENTS (24H)” value “1,284” status “+8.7%”. Card 6: “TRACES (24H)” value “4.7M” status “+23.1%”.

Main layout: Beneath the metric row, create exactly 5 large vertical columns/cards. Column 1 is “NEEDS YOU” with badge count 3 and exactly 3 task cards: “Release blocked” with urgent red styling, “Schema change detected” with yellow approval styling, and “PR #402 open” with purple lifecycle styling. Column 2 is “IN MOTION” with badge count 4 and exactly 3 visible task cards: “Indexer lagging” as a red incident with small x20 badge and tiny bar chart, “Refactor batch running” with teal progress bar, and “Reconnected” with blue session recovered styling. Column 3 is “CHANGED” with badge count 6 and exactly 3 task cards: “v1.4.0 shipped”, “Indexer catching up” with mini bar chart, and “Agent config updated”. Column 4 is “CONDITIONS” with badge count 4 and exactly 3 task cards: “Telemetry not monitored”, “Message bus healthy”, and “Agent pool healthy”. Column 5 is a right-side “SELECTED CONTEXT” details panel focused on {argument name="selected incident" default="Indexer lagging"}, showing a red x20 badge, a red histogram, a vertical timeline with timestamps, and affected service chips.

Selected context details: The right detail panel should include title “Indexer lagging”, subtext “Since 09:25 UTC (16m)” and “20 repositories behind”. Add a red bar chart labeled along the bottom with times around 09:00, 09:15, 09:30, 09:45. Timeline contains exactly 5 entries: “09:42 Lag threshold breached”, “09:37 Alert sent”, “09:36 Auto mitigation started”, “09:34 Partial recovery”, and “09:26 Incident opened”. Add a small button labeled “Investigate”. Affected services chips: “paracortex-core”, “port-1”, “port-indexer”, “port-agent”, “+15 more”.

Bottom activity area: Add an “ACTIVITY TRACE” panel spanning the width under the main columns, labeled “Last 60 minutes”. Include a horizontal time-based trace with multicolored dots, small filter tabs exactly 6: “All”, “Events”, “Commits”, “Jobs”, “Agents”, “Alerts”. On the right of this panel, include a compact event list and a tiny legend with exactly 6 categories: Alerts, Changes, Jobs, Commits, Infra, Info.

Foreground controls: At the bottom center, place a separate rounded glass status dock floating in front of the screen. It contains exactly 4 large counters matching the columns: “Needs you 3” in red, “In motion 4” in blue, “Changed 6” in teal, and “Conditions 4” in amber. In the center bottom of the dock, include a glowing purple-blue cube orb emblem.

Color and style: Use neon cyan outlines, teal and electric blue glow, red for incidents, amber for warnings, purple for lifecycle/session items. UI panels are translucent dark glass with rounded corners. Text is small but mostly legible, technical, dense, and polished. Add subtle reflections on the desk, small physical knobs and screens at the bottom edge, and atmospheric blue light beams.

Constraints: Keep all listed counts exact: 8 sidebar items, 6 top metric cards, 5 main columns, 15 total visible main task/detail cards if counting the right selected context panel, 6 filter tabs, 6 legend categories, and 4 dock counters. Do not add people. Do not use a flat white background. Avoid cartoon styling; make it look like a premium sci-fi SaaS dashboard prototype.
Variáveis de prompt
Marcadores de posição editáveis para argumentos encontrados no prompt, com seus valores padrão.
Variável
product title
Padrão
HOLOGRAPHIC WORKBENCH
Variável
selected incident
Padrão
Indexer lagging
Best for
- - Produto e Comercial visual exploration
- - Image generation and reference-image edits
- - Reusable briefs that keep source attribution visible
Change these parts
- - Subject, product, character, or scene
- - Aspect ratio, camera, lighting, and background
- - Brand, text, color, and output constraints
Recommended model and settings
- - Model: gpt-image-2
- - Input mode: Texto para Imagem
- - Aspect ratio: source
- - Commercial status: review original source
How to use this prompt
- 1. Copy the prompt and preserve its structure for the first test.
- 2. Replace the subject, context, and publishing channel.
- 3. Change one camera, lighting, or style variable per iteration.
- 4. Inspect the output, source, text, and rights before reuse.
Limitations, source, and reuse cautions
- - Generated output is an editable draft, not factual, legal, or rights evidence.
- - Review the linked source, people, brands, logos, text, and third-party media before commercial use.
Importado de Awesome GPT Image 2 Prompts . É necessário dar crédito. O uso comercial é permitido allowed ; revise os direitos da fonte antes de utilizá-lo mediante pagamento.
Mais casos nesta categoria
Priorizados por categoria, compatibilidade do modo de entrada, qualidade e menor risco.

Reutilização e notas de origem
Utilize esta instrução com segurança após visualizar o caso.
- 1.Copie o prompt ou abra-o diretamente no Dovoo com o botão de geração.
- 2.Ajuste as variáveis, a proporção e as imagens de referência de acordo com o seu caso específico.
- 3.Antes de publicar ou utilizar o conteúdo mediante pagamento, verifique os direitos da fonte, os requisitos de atribuição e os riscos relacionados à marca ou à imagem.