Holographic Sci-Fi Operations Dashboard
Generates a cinematic neon glassmorphism command-center dashboard mockup for futuristic SaaS, DevOps, or AI agent monitoring prototypes.
이것은 제품 및 상업 에 대한 GPT Image 2 프롬프트 사례입니다. 아래의 복사 가능한 프롬프트를 사용하여 유사한 시각 자료를 생성하고, 재사용하기 전에 Awesome GPT Image 2 Prompts 의 저작자 표시 및 상업적 사용 권한을 검토하십시오.
전체 프롬프트 세트가 필요하신가요? 다음을 사용하세요. 제품 및 상업 더 많은 관련 예시를 보려면 주제 허브를 열거나 다음을 열어보세요. GPT Image 2 프롬프트 카탈로그 전체 예제 색인, 재사용 가능한 구조 및 출처 표기는 다음을 참조하십시오.
Free 1K preview
Generate one preview image instantly, no sign-up required.
4000/4000
프롬프트
복사 준비 프롬프트
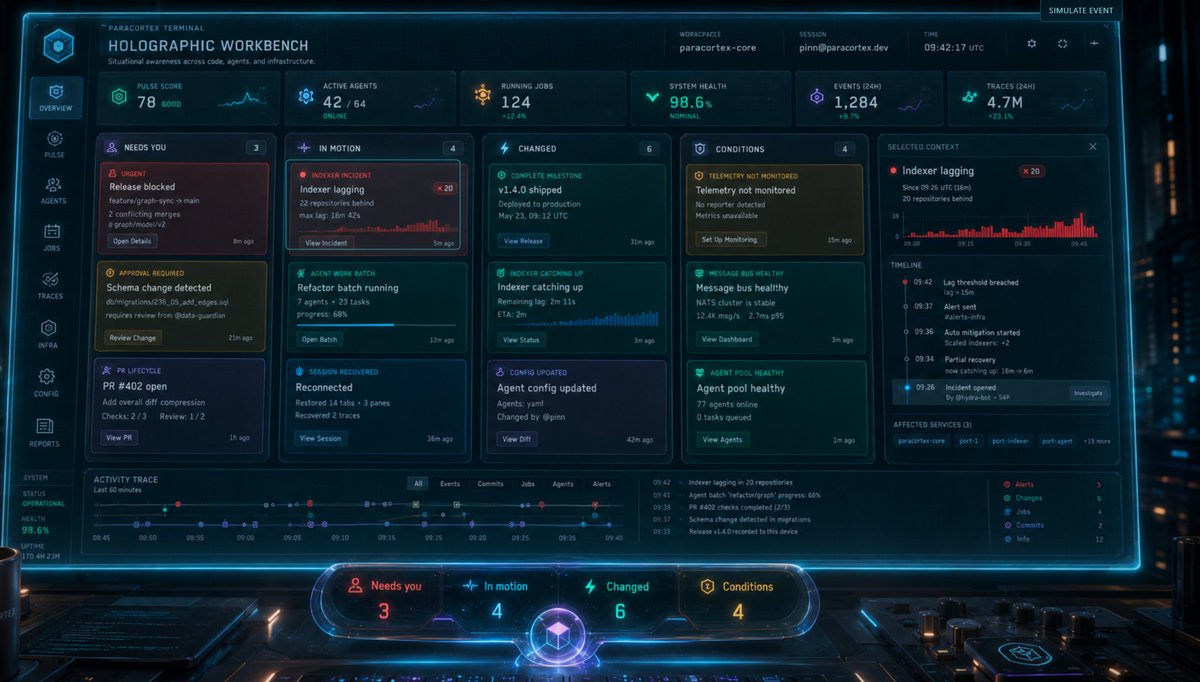
Goal: Create a cinematic sci-fi product mockup of a futuristic operations dashboard titled {argument name="product title" default="HOLOGRAPHIC WORKBENCH"}, floating as a transparent neon-blue holographic screen above a dark control desk in a cyberpunk command center.

Canvas: Wide 16:9 landscape interface screenshot, dark navy/black glassmorphism UI, glowing cyan borders, subtle scanlines, tiny grid texture, high detail, realistic GPT-image-2 style render, shallow depth of field with blurred server lights in the background. The interface should feel like a clickable prototype built on top of a beautiful concept render.

Header: Top-left brand text reads “PARACORTEX TERMINAL” above the main title “HOLOGRAPHIC WORKBENCH” with the subtitle “Situational awareness across code, agents, and infrastructure.” Top-center metadata shows exactly 3 fields: Workspace “paracortex-core”, Session “[email protected]”, Time “09:42:17 UTC”. Top-right includes a small button labeled “SIMULATE EVENT” plus tiny gear, sync, and plus icons.

Left navigation: A vertical glowing sidebar with exactly 8 icon navigation items labeled, from top to bottom: Overview, Pulse, Agents, Jobs, Traces, Infra, Config, Reports. At the lower left, include a small system status panel with Status “Operational”, Health “98.6%”, and Uptime “170 4H 23M”.

Top metric row: Show exactly 6 stat cards across the top. Card 1: “PULSE SCORE” value “78” status “GOOD” with a small line graph. Card 2: “ACTIVE AGENTS” value “42 / 64” status “ONLINE”. Card 3: “RUNNING JOBS” value “124” status “+12.4%”. Card 4: “SYSTEM HEALTH” value “98.6%” status “NOMINAL”. Card 5: “EVENTS (24H)” value “1,284” status “+8.7%”. Card 6: “TRACES (24H)” value “4.7M” status “+23.1%”.

Main layout: Beneath the metric row, create exactly 5 large vertical columns/cards. Column 1 is “NEEDS YOU” with badge count 3 and exactly 3 task cards: “Release blocked” with urgent red styling, “Schema change detected” with yellow approval styling, and “PR #402 open” with purple lifecycle styling. Column 2 is “IN MOTION” with badge count 4 and exactly 3 visible task cards: “Indexer lagging” as a red incident with small x20 badge and tiny bar chart, “Refactor batch running” with teal progress bar, and “Reconnected” with blue session recovered styling. Column 3 is “CHANGED” with badge count 6 and exactly 3 task cards: “v1.4.0 shipped”, “Indexer catching up” with mini bar chart, and “Agent config updated”. Column 4 is “CONDITIONS” with badge count 4 and exactly 3 task cards: “Telemetry not monitored”, “Message bus healthy”, and “Agent pool healthy”. Column 5 is a right-side “SELECTED CONTEXT” details panel focused on {argument name="selected incident" default="Indexer lagging"}, showing a red x20 badge, a red histogram, a vertical timeline with timestamps, and affected service chips.

Selected context details: The right detail panel should include title “Indexer lagging”, subtext “Since 09:25 UTC (16m)” and “20 repositories behind”. Add a red bar chart labeled along the bottom with times around 09:00, 09:15, 09:30, 09:45. Timeline contains exactly 5 entries: “09:42 Lag threshold breached”, “09:37 Alert sent”, “09:36 Auto mitigation started”, “09:34 Partial recovery”, and “09:26 Incident opened”. Add a small button labeled “Investigate”. Affected services chips: “paracortex-core”, “port-1”, “port-indexer”, “port-agent”, “+15 more”.

Bottom activity area: Add an “ACTIVITY TRACE” panel spanning the width under the main columns, labeled “Last 60 minutes”. Include a horizontal time-based trace with multicolored dots, small filter tabs exactly 6: “All”, “Events”, “Commits”, “Jobs”, “Agents”, “Alerts”. On the right of this panel, include a compact event list and a tiny legend with exactly 6 categories: Alerts, Changes, Jobs, Commits, Infra, Info.

Foreground controls: At the bottom center, place a separate rounded glass status dock floating in front of the screen. It contains exactly 4 large counters matching the columns: “Needs you 3” in red, “In motion 4” in blue, “Changed 6” in teal, and “Conditions 4” in amber. In the center bottom of the dock, include a glowing purple-blue cube orb emblem.

Color and style: Use neon cyan outlines, teal and electric blue glow, red for incidents, amber for warnings, purple for lifecycle/session items. UI panels are translucent dark glass with rounded corners. Text is small but mostly legible, technical, dense, and polished. Add subtle reflections on the desk, small physical knobs and screens at the bottom edge, and atmospheric blue light beams.

Constraints: Keep all listed counts exact: 8 sidebar items, 6 top metric cards, 5 main columns, 15 total visible main task/detail cards if counting the right selected context panel, 6 filter tabs, 6 legend categories, and 4 dock counters. Do not add people. Do not use a flat white background. Avoid cartoon styling; make it look like a premium sci-fi SaaS dashboard prototype.
프롬프트 변수
프롬프트에 있는 편집 가능한 인수 자리 표시자와 해당 기본값입니다.
변하기 쉬운
product title
기본
HOLOGRAPHIC WORKBENCH
변하기 쉬운
selected incident
기본
Indexer lagging
Best for
- - 제품 및 상업 visual exploration
- - Image generation and reference-image edits
- - Reusable briefs that keep source attribution visible
Change these parts
- - Subject, product, character, or scene
- - Aspect ratio, camera, lighting, and background
- - Brand, text, color, and output constraints
Recommended model and settings
- - Model: gpt-image-2
- - Input mode: 텍스트 to 이미지
- - Aspect ratio: source
- - Commercial status: review original source
How to use this prompt
- 1. Copy the prompt and preserve its structure for the first test.
- 2. Replace the subject, context, and publishing channel.
- 3. Change one camera, lighting, or style variable per iteration.
- 4. Inspect the output, source, text, and rights before reuse.
Limitations, source, and reuse cautions
- - Generated output is an editable draft, not factual, legal, or rights evidence.
- - Review the linked source, people, brands, logos, text, and third-party media before commercial use.
Awesome GPT Image 2 Prompts 에서 가져왔습니다. 출처 표기가 필요합니다. 상업적 이용 가능 여부는 allowed 입니다. 유료 사용 전에 원저작권 정보를 확인하세요.
이 범주에 속하는 더 많은 사례
범주, 입력 방식 호환성, 품질 및 위험도에 따라 우선순위가 정해집니다.



재사용 및 출처 참고 사항
사례를 미리 확인한 후 이 안내 메시지를 안전하게 사용하십시오.
- 1.프롬프트를 복사하거나 Dovoo의 생성 버튼을 사용하여 직접 엽니다.
- 2.사용 사례에 맞게 변수, 화면 비율 및 참조 이미지를 조정하십시오.
- 3.출판 또는 유료 사용 전에 저작권, 출처 표기 요건 및 브랜드 또는 초상권 관련 위험을 확인하십시오.