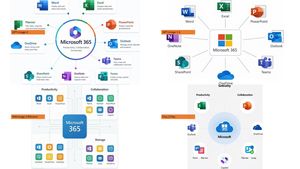
Microsoft 365 Model Comparison Infographic
Create a four-quadrant PowerPoint-style comparative infographic that displays a Microsoft 365 ecosystem chart with image-generated model annotations.
Prompt
Copy-ready prompt
Using the provided reference images as initial inspiration for the official explanatory slides/infographics, create a clear contrasting image showcasing the same Microsoft 365 ecosystem concept generated under four different model styles. Canvas and Layout: 16:9 white slides, precisely divided into four quadrants using a 2x2 grid, with ample white space and no obvious dividing lines. Themes: Each quadrant should display a theme {argument name="main product name" default="Microsoft 365"} Centered on the Microsoft 365 ecosystem, this diagram radiates outwards, surrounded by Microsoft app icons and brief English labels. Quadrants and visible orange model labels: Containing 4 orange labels, one for each quadrant: 1. Top Left:{argument name="first model label" default="GPT-Image-2"} — A beautifully designed circular Microsoft 365 central image, surrounded by multiple application cards. 2. Top right:{argument name="second model label" default="GPT-Image-1.5"} — A simple radial center image surrounding the central Microsoft 365 box. 3. Bottom left:{argument name="third model label" default="MAI Image 2 Efficient"} — Structured dashboard-style charts, including grouped sections for productivity, collaboration, and storage. 4. Bottom right:{argument name="fourth model label" default="Flux.2 Flex"} — A soft, circular chart with icons rotating around a central Microsoft Cloud-style logo. Applications included in the chart: Word, Excel, PowerPoint, Outlook, Teams, OneDrive, SharePoint, OneNote, Planner, Forms, Loop, and Copilot (if applicable). Please use recognizable Microsoft-style colored application icons, but keep the overall design as a generated chart, not a screenshot. Style: Modern enterprise-grade PowerPoint infographic style, clear and legible English text, flat vector icons, subtle shadows, light gray connecting lines, a predominantly white background, and a Microsoft blue/green/orange/purple color scheme. Keep the overall image clean and presentation-ready.Prompt variables
Editable argument placeholders found in the prompt, with their default values.
Variable
main product name
Default
Microsoft 365
Variable
first model label
Default
GPT-Image-2
Variable
second model label
Default
GPT-Image-1.5
Variable
third model label
Default
MAI Image 2 Efficient
Variable
fourth model label
Default
Flux.2 Flex
More cases in this category
Prioritized by category, input mode compatibility, quality, and lower risk.

Illustration-style personal sketch infographic
single image to imageunknown
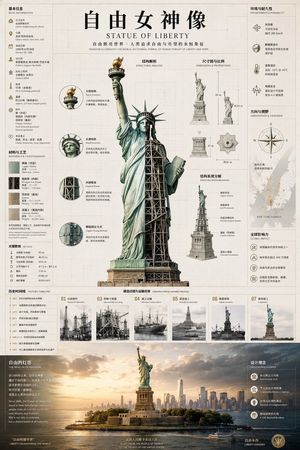
Statue of Liberty technical infographic
single image to imageunknown

Anime Mentor Whiteboard Infographic
single image to imageunknown

Microsoft 365 Model Comparison Infographic
single image to imageunknown

DX Infographic Model Comparison
single image to imageunknown

Human Organ Health Infographic
single image to imageunknown
Reuse and source notes
Use this prompt safely after previewing the case.
- 1.Copy the prompt or open it directly in Dovoo with the generation button.
- 2.Adjust variables, aspect ratio, and reference images for your own use case.
- 3.Before publishing or paid usage, verify source rights, attribution requirements, and brand or likeness risks.
Can I use this prompt commercially?
Commercial-use status is unknown. Review the original source, license, brand constraints, and legal requirements before paid usage.
Where does this case come from?
This case is imported from YouMind OpenLab awesome-gpt-image-2; keep attribution visible and check the source URL before reuse.